lumi **

Lumi is an ongoing project for Illumina microarray data analysis, including the design of a software package in R/Bioconductor and the discussion of microarray experiment design.

** an open source project at the Bioinformatics Core of the Robert H. Lurie Comprehensive Cancer Center, Northwestern University.

8.30.2006

Illumina UML model

When you are talking about an "array", it can be confusing for the Illumina platform.

Why? Illumina is an "array-of-array" platform. Some poeple use the word "array" the same as "chip"; it can create a big problem in the communication!

To formally specify a model for the knowledge domain of Illumina, we used the Unified Modeling Language (UML). A draft model can be like this:

8.29.2006

Lumi Package: Architecture

lumiR: data I/O. read in Illumina data file.
lumiQ: quality control
lumiT: variance-stabilizing data transformation
lumiN: normalization
lumi: all-in-one Illumina data processing, including all the aboves.

There will be a data package and an annotation package. I have discussed the annotation package with Lynn Amon at University of Washington.

The down-stream analysis will follow the existing infrastructure in the Bioconductor package, since we use the exprSet (eSet).

The Core Algorithm of Lumi

The core algorithm of Lumi is a variance-stabilizing transformation. The major idea is that measurements at lower intensities are unreliable, and thus their fold changes (for example, 50/25= 2 fold, where the noises are around 20) should be discounted comparing to measurements at high intensity (say, 40,000 / 20,000 = 2 fold, where the noises are around 1,000).

This is very much intuitive. In a sense, it is similar to the previous approach of VSN (variance-stabilizing normalization) by Dr. Huber at the EBI. We will discuss their differences in the following section.

Does the lumi transformation work?
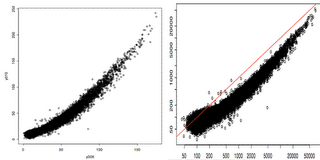
In the figure above, we plotted two technical replicates after lumi transformation (left) and log2 transformation (right). As we expected, the log2 transformation over-inflated the noise at the lower end. Note that the normalization step will take care of the curvature.

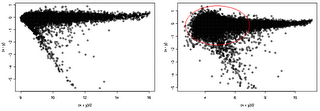
Here we provide additional assessment of the lumi transformation for a pair of treated vs. control arrays. One the left side, we have MvA (difference vs. average) plot of lumi transformed and normalized data. The VSN algorithm (right side) did not adequately stabilize the variance, as evidenced by the larger variance at the low intensity end.

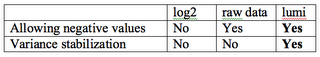
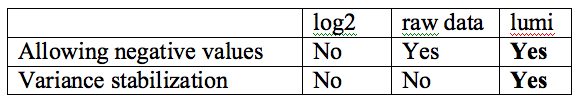
Here is a summary of comparing different data transformation algorithms.

The Lumi Project

We got our first request of Illumina microarray data analysis a couple of weeks ago. Using the "affy" package to treat it as a single-color array, we found the results unsatisfying. Thus, we started developing a new R/Bioconductor package specially designed for the Illumina platform.

We need a name for this new package!

After having some comfy food at a lunch break with Sean Whitaker, Dave Knapik, Dong Fu and Edgar Garcia, we decided to name the new R package “lumi”.

It rhymes well with the existing “affy” package. The other candidates were “luminati”, “luminata”, and “loomy”, but most of them were taken at this blog website.

Dong suggested there might be a cartoon character called “lumi”. Indeed, we found it at www.loomy.net. For $18, you can get a loomy mascot at
http://www.etsy.com/view_item.php?listing_id=215120

Now, we have got a project code name and a cute mascot! Ready to work on the algorithms.