Tricks of Experiment Design
Before we start discussing the optimal experiment design, we should first review some basics of the Illumina expression array platform. There are six arrays on the Illumina WG-6 human genome chip (Figure 1). This is very different from the Affymetrix design or the home-made glass-slide arrays! A special term “array-of-arrays” was coined to describe this unique arrangement. We use two different words, “arrays” and “chips”, to indicate this difference.

Array: one of the six arrays on the chip.
Chip: the slide that contains six arrays.
Obviously, the six arrays on the same chip will have more consistent hybridizing conditions than arrays across slides. Thus, it is called a block, in terms of statistical experiment design.
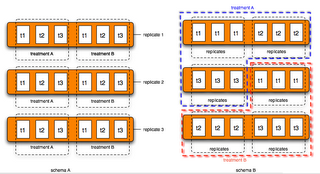
To make a more solid example, let us consider a hypothetical experiment (Figure 2). We want to find the difference between treatment A and treatment B over a time course (t1-- early response; t2-- immediate response; t3-- late response). Suppose we have three biological replicates at each time point to address the biological variations. It will end up with 3 (time points) *2 (treatments) *3 (replicates) = 18 (arrays). Remember there are 6 arrays on each Illumina chip. So, we need 3 chips.

How do we put these 18 arrays on the three chips? Let us compare the following two experiment designs (Figure 3):
Schema A: block design
Schema B: confounded design

We prefer schema A over schema B. Why? Here are two statistical terms frequently used in guiding experiment designs.
BLOCKING -- “Blocking is the arranging of experimental units in groups (blocks) which are similar to one another. For example, an experiment is designed to test a new drug on patients. There are two levels of the treatment, drug, and placebo, administered to male and female patients in a double blind trial. The sex of the patient is a blocking factor accounting for treatment variablility between males and females. This reduces sources of variability and thus leads to greater precision.” -- Wikipedia
CONFOUNDING—“Confounding variable is a "hidden" variable in a statistical or research model that affects the variables in question but is not known or acknowledged, and thus (potentially) distorts the resulting data. For example, ice cream consumption and murder rates are highly correlated. Now, does ice cream incite murder or does murder increase the demand for ice cream? Neither: they are joint effects of a common cause or lurking variable, namely, hot weather. Another look at the sample shows that it failed to account for the time of year, including the fact that both rates rise in the summertime.” -- Wikipedia

0 Comments:
Post a Comment
<< Home